UV-1900i Plus - Features
UV-Vis Spectrophotometer
Refined User-Friendliness
Easy-to-Use Interface
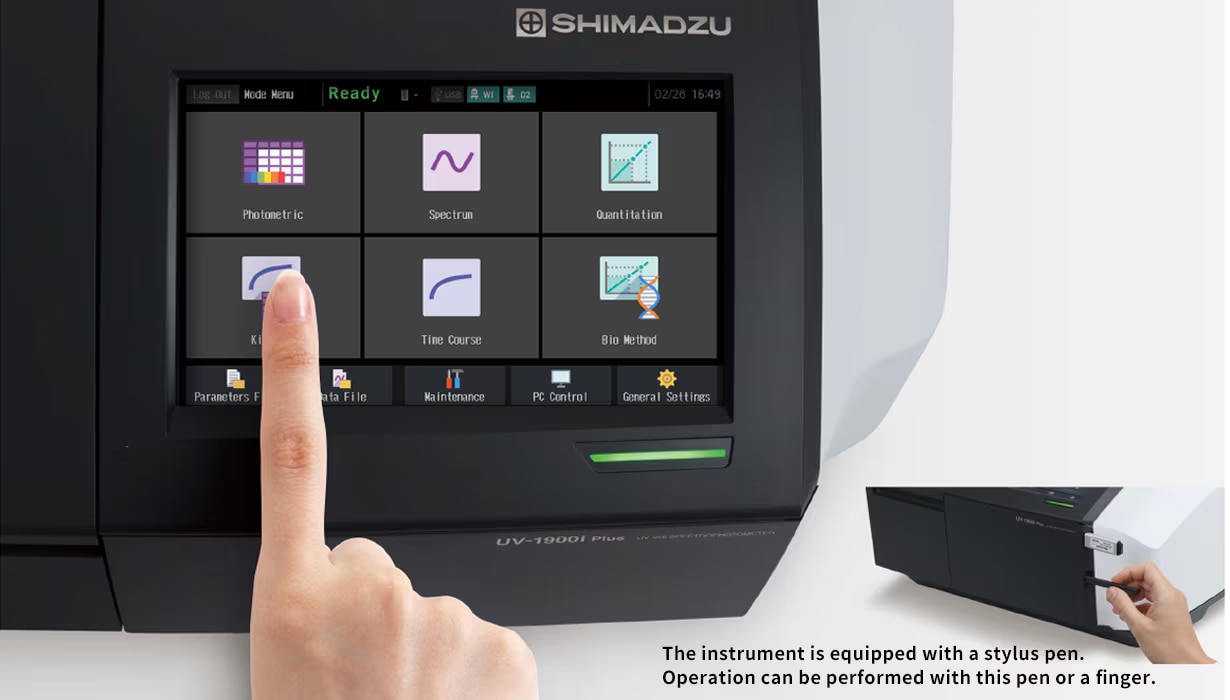
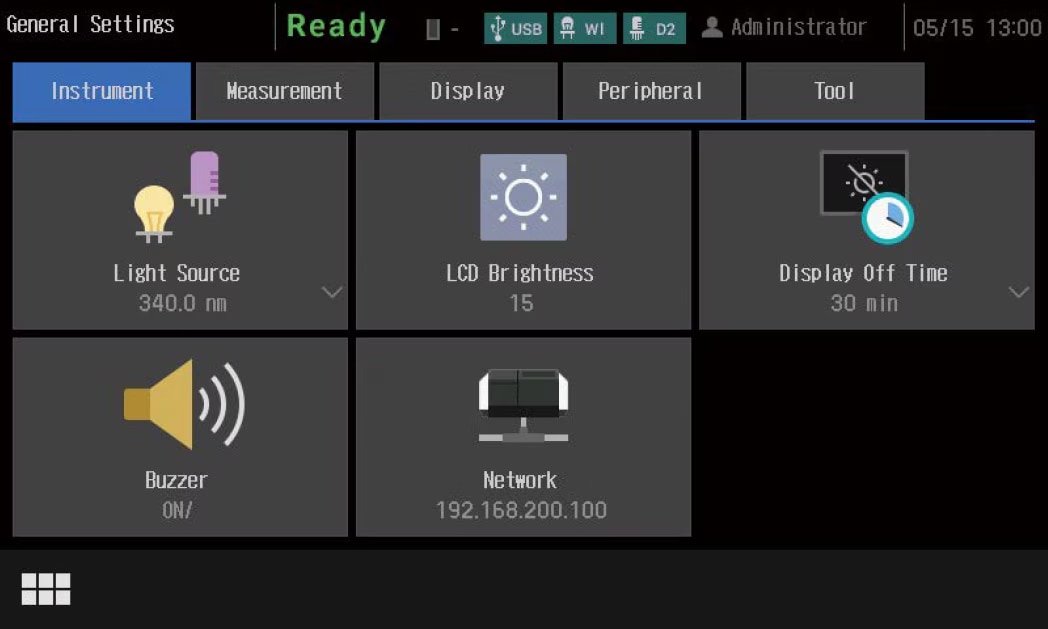
Grasp the Current Status and Operating Procedures at a Glance
Display languages are available in eight languages (Japanese, English, Chinese, Spanish, Portuguese, German, French, Russian).
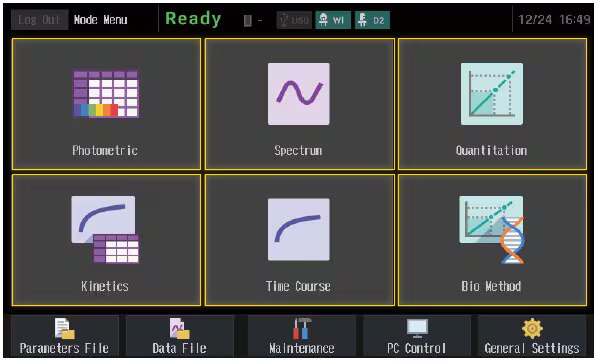
The UV-1900i Plus on-screen user interface includes large, easy-to-see icons deployed on a black background, so the instrument settings are evident at a glance. In addition, the large, easy-to-see icons improve intuitive understanding, which enables users to quickly become familiar with the operations. Furthermore, the user interface is designed to minimize transitions between windows, so users do not get confused during the operations. The system also features a faster response speed by adopting a new CPU.
Multiple Measurement Modes
UV-1900i Plus has six basic measurement modes, which offer the optimal solution for a variety of measurements.
-
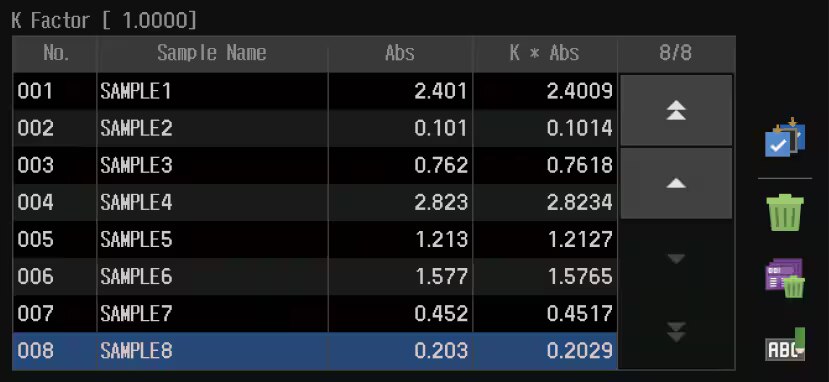
Photometric
Measures the photometric value at a single wavelength or multiple (up to eight) wavelengths.
-
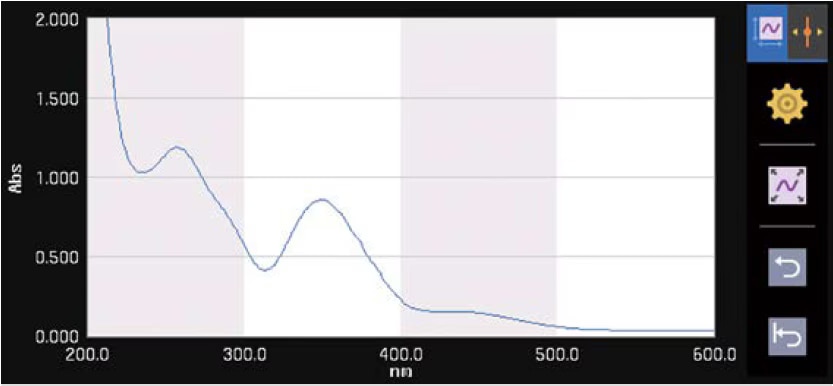
Spectrum
Measures a sample spectrum using wavelength scanning.
-
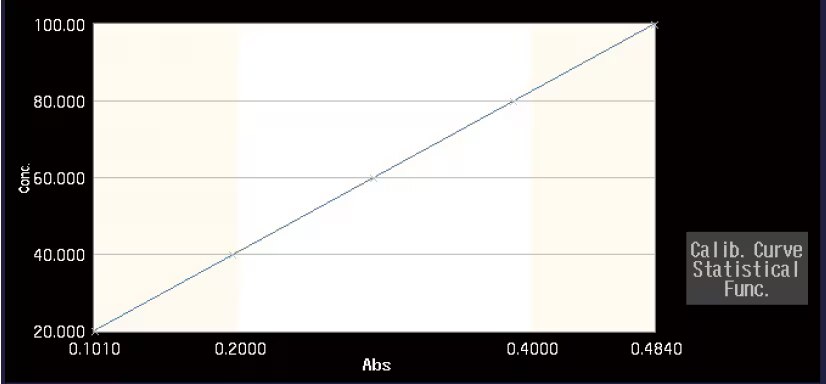
Quantitation
Generates a calibration curve from the measurement of standards, and then calculates the concentrations of unknowns.
-
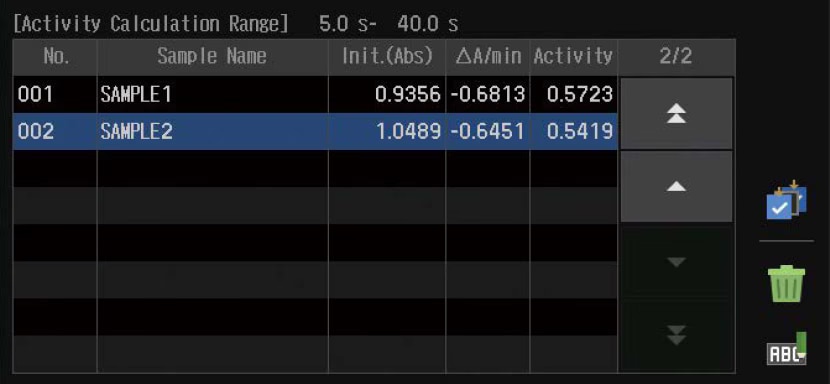
Kinetics
Measures the photometric value at a single wavelength or multiple (up to eight) wavelengths.
-
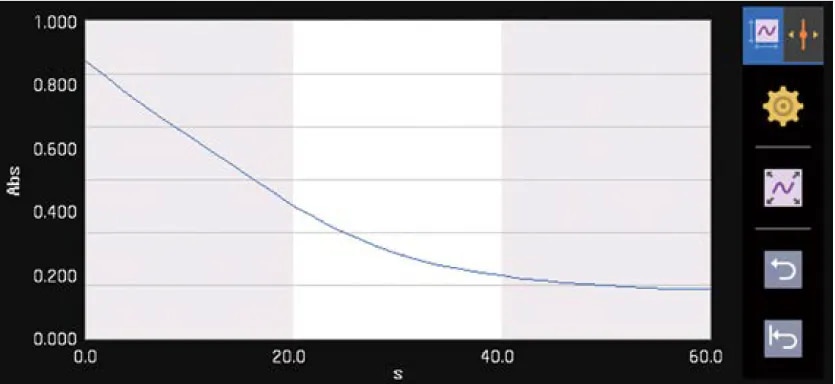
Time Course
Measures a sample spectrum using wavelength scanning.
-
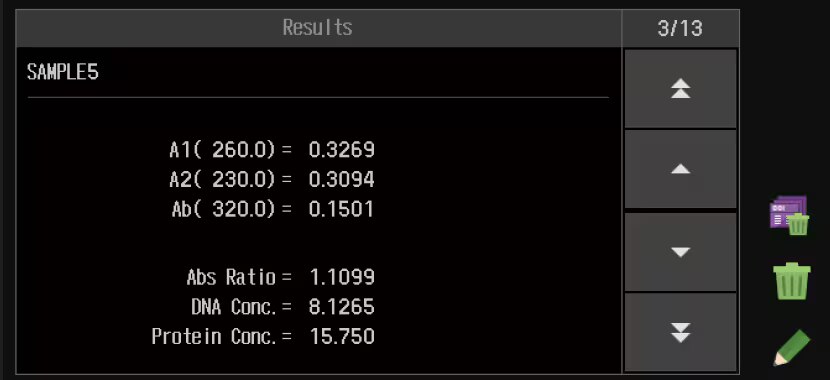
Biomethod
Measures the photometric value at a single wavelength or multiple (up to eight) wavelengths.
* The background color of the operation screen can also be set to white.
Various Functions For Comfortable Daily Measurement
Assist Function
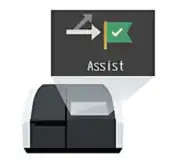
The instrument assists the user to ensure that measurements
are performed using the correct procedure.*1
-
Measures the photometric value at a single wavelength or multiple (up to eight) wavelengths.
-
Measures a sample spectrum using wavelength scanning.
-
Measures the photometric value at a single wavelength or multiple (up to eight) wavelengths.
*1 This function can be enabled/disabled.
-
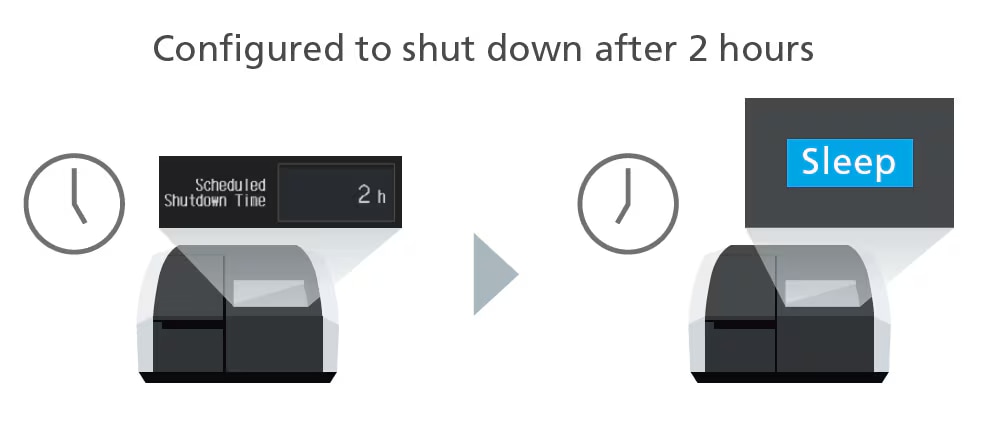
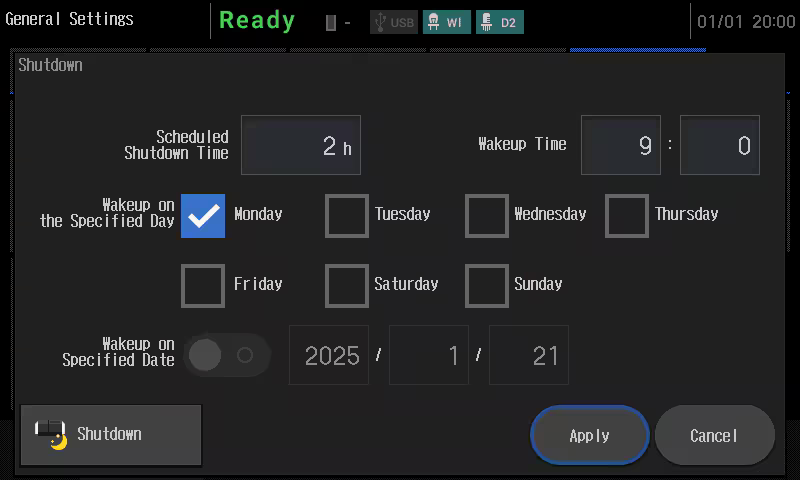
Shutdown Function
The shutdown function puts UV-1900i Plus to sleep after it's been used, or after a certain period of time. Putting the instrument into sleep mode limits power consumption and helps preserve the lamp.
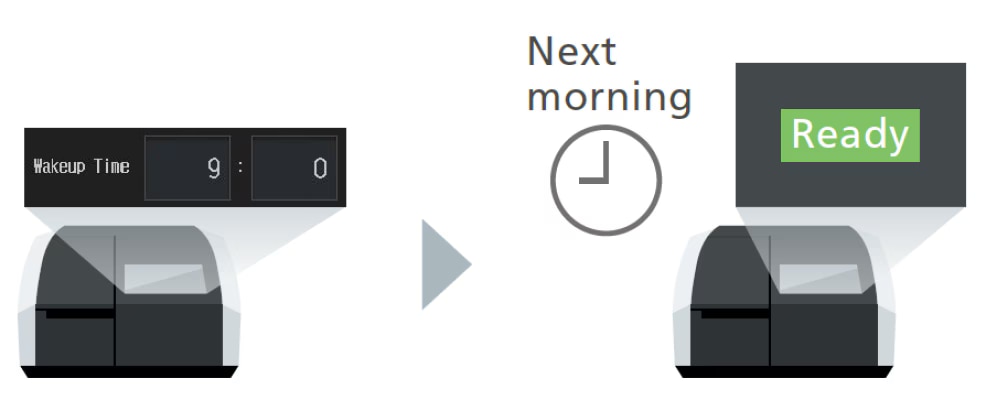
Wakeup Function
Automatically wakes up a sleeping UV-1900i Plus at a specified time. This function eliminates the need for analysts to wait for it to warm up, allowing them to be more productive.
-
Startup Validation Function
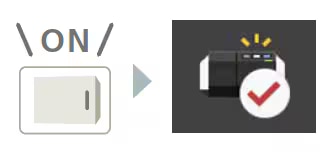
Instrument performance checks can be performed automatically when the instrument is turned ON.*2
This enables even more reliable instrument operation.
It can also be implemented in combination with the Wakeup function.
*2 This function can be enabled/disabled.
The performance check items that can be used with this function are as follows: wavelength accuracy (D2), wavelength repeat accuracy (D2), degradation, noise level, baseline flatness, baseline stability (drift), [EP] Control of Wavelength Accuracy (D2), and [USP] Control of Wavelengths (D2).
Network Connectivity Function
Data can now be transferred to a PC via a network. With wireless printing, multiple UV units can print from a single printer.*3 (A router and other network equipment must be installed to use a network.)
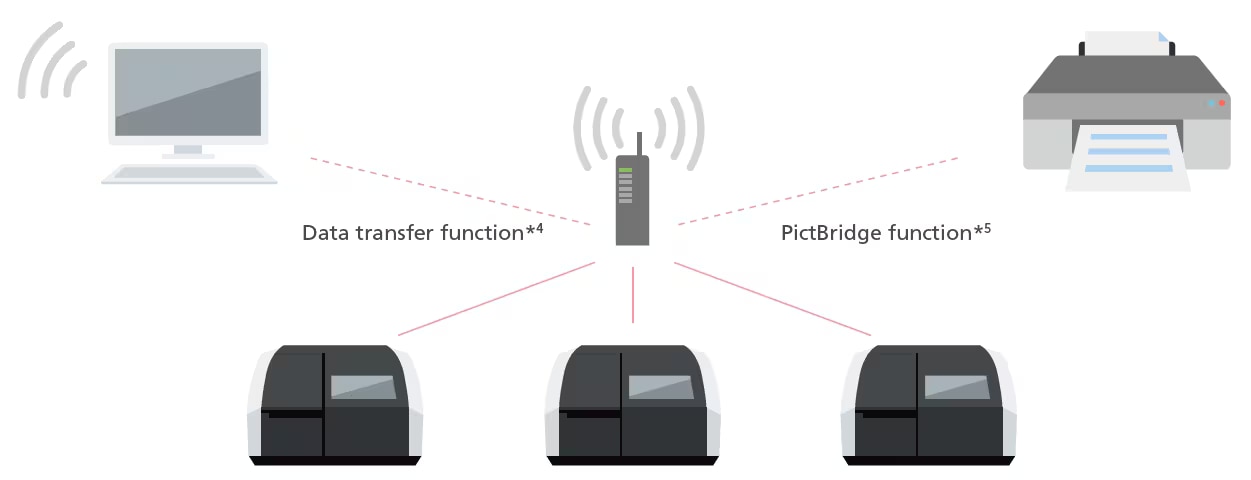
*3 A router with a wireless function is required.
*4 Optional expanded memory is required. The instrument is not compatible with control via a network.
*5 A PictBridge-compatible printer is required.
Bar-Code Reader And Keyboard Entry Function
Sample names and numerical values can be entered by a bar-code reader or from the keyboard.
This saves time when entering sample names for a multiple-sample analysis, and prevents sample misidentification and other human errors.*6
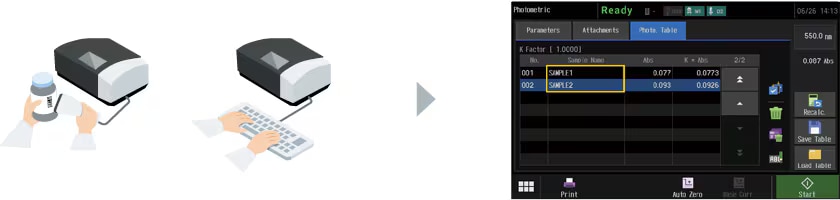
*6 Use a bar-code reader and keyboard with a USB connection.
High Performance To Meet Diverse Needs
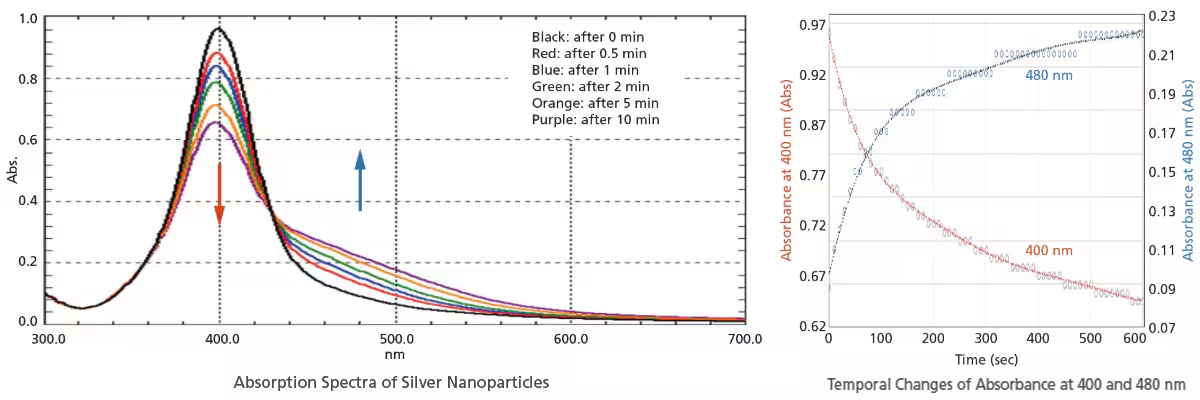
Ultra-Fast Scan
Spectra can be acquired as fast as 29,000 nm/min. Ultra-fast scanning is effective in tracking chemical reactions in a short time. In addition to the absorbance change at specified wavelengths, spectra can also be acquired in a short time with the UV-1900i Plus. Therefore, more detailed behavior can be investigated by observing spectra with the UV-1900i Plus.
The figures below show the analysis of the particle agglomeration process when salts are added to silver nanoparticles. Measurements of the 300 to 700 nm region were performed in ultra-fast scan mode. In addition to the decrease of absorbance at 400 nm and the increase of absorbance at 480 nm, the temporal changes of spectra can also be observed.
Low Stray Light
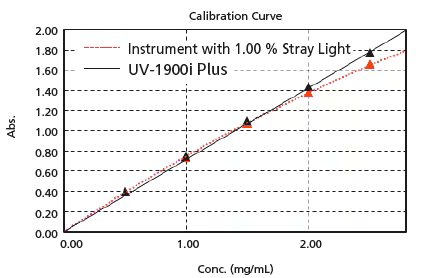
Linearity will be lost in the high absorbance region due to stray light. UV-1900i Plus is equipped with Low Stray Light Diffraction Gratings, achieve “best-in-class” low stray light. Stray light is at 0.5 % max. (198 nm), making accurate measurements possible at 1 Abs or more, even in the ultraviolet region. In addition, high-concentration samples can be quantified accurately.
The figure on the right is a calibration curve for acetic acid, created with absorbance at 200 nm. The correlation coefficient is 0.9998 and correct measured values are obtained even with high-concentration samples.
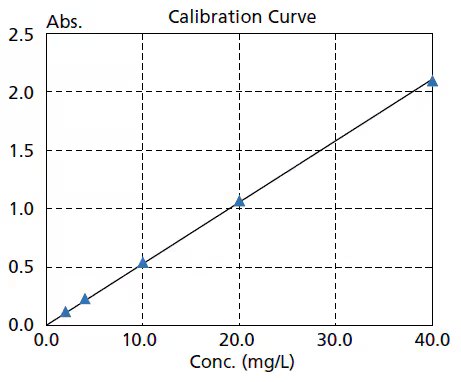
High Reproducibility And Repeatability Accuracy
The photometric repeatability accuracy is 0.0002 Abs max. (0.5 Abs and 1.0 Abs). As a result, variance in the measurement results is suppressed, enabling more accurate quantitation and the detection of low-concentration samples.
The figure on the right is a calibration curve for caffeine, created with absorbance at 273 nm.
The calibration curve has an Abs = 0.0528 Conc. The lower limit of quantitation determined from the standard deviation is 0.0051 mg/L.
Note: One method of determining the lower limit of quantitation is to use ten times the standard deviation. This is an actual measured value and is not guaranteed.
| No. | Absorbance of Blank Solution(273 nm) |
|---|---|
| 1 | -0.00001 |
| 2 | 0.00001 |
| 3 | -0.00002 |
| 4 | 0.00002 |
| 5 | 0.00001 |
| 6 | -0.00003 |
| 7 | 0.00001 |
| 8 | -0.00004 |
| 9 | 0.00001 |
| 10 | 0.00005 |
| Standard Deviation σ | 0.000025 |